

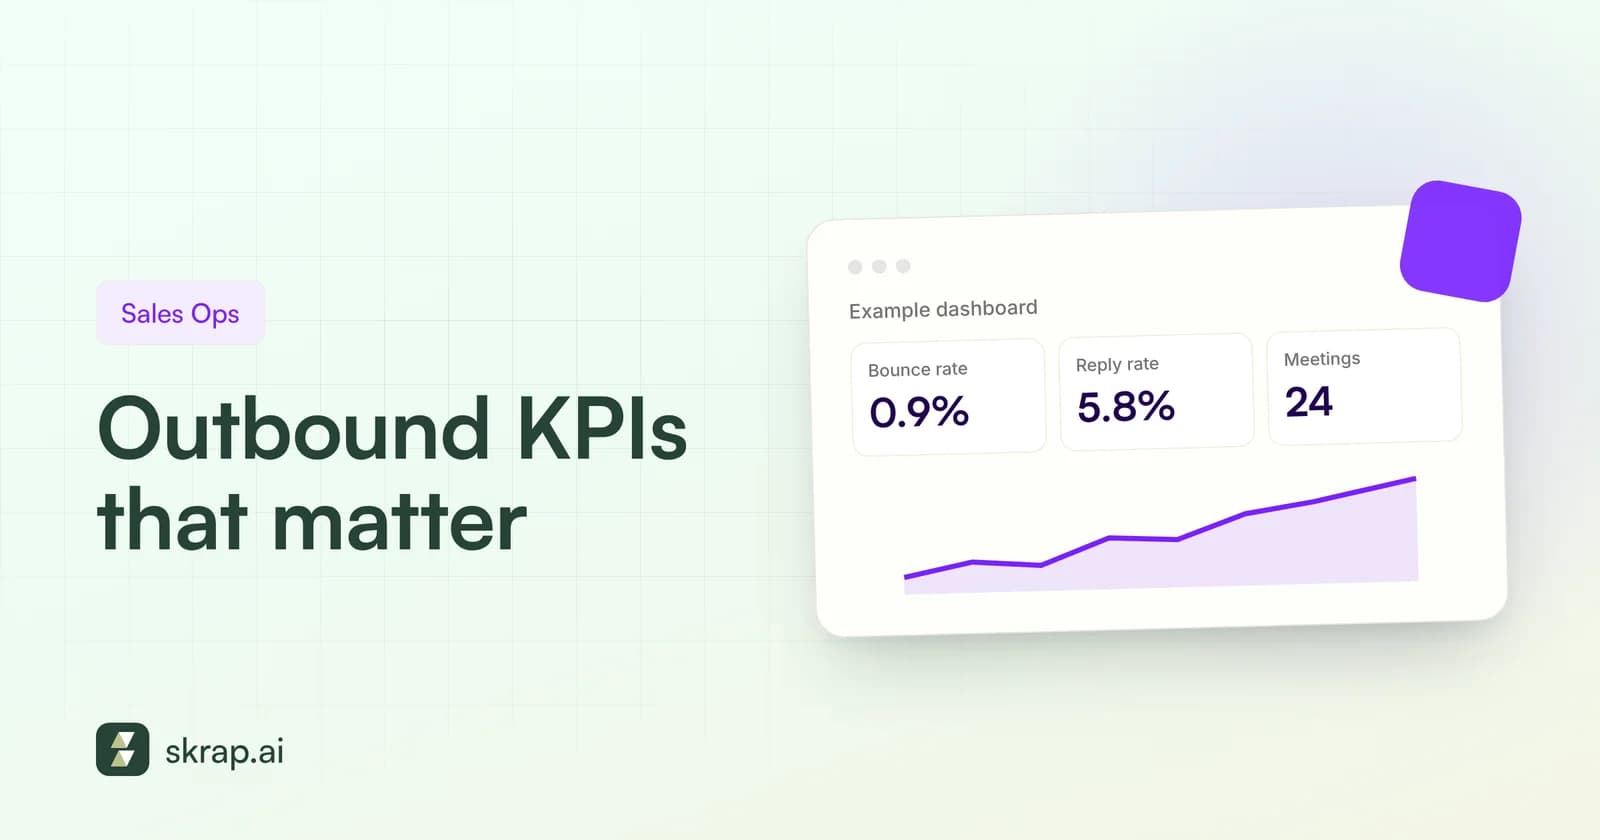
Outbound teams are drowning in metrics: opens, clicks, sends, sequences, tasks, dials. Most of them describe activity, not results. The KPIs that actually predict revenue are fewer and simpler, and they line up as a funnel from the first email to the closed deal.
This guide covers the six outbound lead generation KPIs worth tracking every week: bounce rate, reply rate, positive reply rate, meetings booked, cost per meeting, and pipeline generated. For each, you'll get a formula, a published benchmark where a credible one exists, and an explanation of how data quality moves the number.
One rule before we start: we only cite benchmarks from sources we could open and check, and we note the year and dataset for each. Where no trustworthy benchmark exists, we say so.
Think in funnels, not dashboards
Every outbound KPI is a conversion step. A message has to be delivered before it can be replied to, a reply has to be positive before it becomes a meeting, and a meeting has to qualify before it becomes pipeline. When a number at the bottom drops, the cause is usually a step above it.
- 1Contacts sent – people who received a first email
- 2Delivered – sent minus bounces
- 3Replied – any human response
- 4Positive replies – interest, a referral, or a request for info
- 5Meetings booked – a call on the calendar
- 6Pipeline – qualified opportunities and their value
Notice what's missing: open rate. Smartlead excludes opens from its 2026 benchmark report because Apple Mail's automatic image loading inflates them, and SmartReach.io leaves them out for the same reason plus security scanners. Use opens as a rough deliverability signal at most, never as a KPI.
The 6 outbound KPIs that matter
1. Bounce rate
The share of sent emails that couldn't be delivered. It's the first KPI because it caps everything else and because mailbox providers read high bounces as a sign you're mailing addresses you never confirmed. Track hard bounces (permanent, such as nonexistent mailboxes) separately from soft bounces (temporary, such as full inboxes).
2. Reply rate
Human replies divided by contacts emailed. Count per prospect, not per message, and exclude out-of-office and auto-replies. SmartReach.io's methodology does both, which makes its numbers easier to compare with your own.
3. Positive reply rate
Replies that show interest, refer you to the right person, or ask for more information, divided by contacts emailed. This is the best single read on whether your targeting and message match a real need. Some teams also track positive replies as a share of all replies, which isolates message quality from list size.
4. Meetings booked
The count of meetings scheduled from outbound, and the meeting rate (meetings divided by contacts emailed). Track no-shows too; a meeting that doesn't happen isn't a meeting.
5. Cost per meeting
Everything you spent on outbound in a period divided by meetings held. Include tools, data, sending infrastructure, and the loaded cost of the people doing the work. This is the KPI that tells finance whether outbound is worth funding.
6. Pipeline generated
The number and value of qualified opportunities created from outbound meetings. It's the KPI leadership cares about most, and the slowest to show change, which is why the faster KPIs above matter so much for week-to-week decisions.
Outbound KPI formulas
Pick one denominator and stick with it. Mixing 'per email sent' and 'per contact' is the most common reason internal numbers don't match vendor benchmarks.
| KPI | Formula | What it tells you |
|---|---|---|
| Bounce rate | Bounced emails ÷ emails sent × 100 | List quality and data freshness |
| Spam complaint rate | Spam reports ÷ emails delivered × 100 | Whether recipients see you as unwanted |
| Reply rate | Unique human replies ÷ contacts emailed × 100 | Relevance of targeting and message |
| Positive reply rate | Positive replies ÷ contacts emailed × 100 | Real demand for what you offer |
| Reply-to-positive ratio | Positive replies ÷ total replies × 100 | Message quality, independent of volume |
| Meeting rate | Meetings booked ÷ contacts emailed × 100 | End-to-end funnel efficiency |
| Show rate | Meetings held ÷ meetings booked × 100 | Meeting quality and follow-through |
| Cost per meeting | Total outbound cost ÷ meetings held | Economic efficiency of outbound |
| Pipeline per 1,000 contacts | Pipeline value ÷ (contacts emailed ÷ 1,000) | Revenue potential of a list or segment |
Sourced outbound benchmarks for 2026
Benchmarks differ a lot depending on whose platform the data comes from, how a reply is defined, and which senders are included. Read the table below as ranges to orient by, not targets to hit.
| Metric | Benchmark | Source and dataset |
|---|---|---|
| Bounce rate | Typical sender 1.54%; top quarter of bouncers at 3.21%+; 2% flagged as the danger line | Smartlead, 2026 – 850M+ emails, senders with 500+ sends |
| Reply rate | Median 0.74%; top 25% 1.43%; top 10% 2.63%; top 5% 3.85% | Smartlead, 2026 – 850M+ emails |
| Reply rate | Agency cohort about 10% (Jan–Jun 2026, 40M+ emails) | SmartReach.io (agency cohort: Jan–Jun 2026, 40M+ emails, 5,000+ campaigns) |
| Positive reply rate | About 2.2% (roughly 1 in 5 replies is positive) | SmartReach.io agency cohort, Jan–Jun 2026 |
| Meeting booked rate | About 1.2% | SmartReach.io agency cohort, Jan–Jun 2026 |
| Replies from follow-ups | 58.6% of replies came from steps 2–6 | Belkins, 2026 study – 7.5M emails sent in 2025 |
| Spam complaint rate | Must stay below 0.3%; Google recommends below 0.1% | Google email sender guidelines |
You'll notice two gaps: cost per meeting and pipeline. We didn't find public benchmarks for either that disclosed a dataset and method we could verify. They depend heavily on your deal size, sales cycle, and team costs, so your own trailing three-month baseline is the right comparison.
A worked example (hypothetical numbers)
To see how the formulas connect, here's an illustrative month for a small outbound team. These figures are made up for the example; they are not benchmarks or customer results.
| Step | Count | KPI |
|---|---|---|
| Contacts emailed | 2,000 | – |
| Bounced | 30 | Bounce rate 1.5% |
| Unique replies | 60 | Reply rate 3.0% |
| Positive replies | 16 | Positive reply rate 0.8% |
| Meetings held | 8 | Meeting rate 0.4% |
| Total outbound cost | $4,000 | Cost per meeting $500 |
Now imagine the same team skipped verification and bounced at 6%. They'd lose 90 more deliverable contacts, and the bounces would hurt inbox placement for the rest of the list too. Fewer inboxed emails means fewer replies, fewer meetings, and a higher cost per meeting, even with identical copy.
How data quality affects every KPI
Most KPI problems trace back to the list. Here's how bad data shows up at each stage, and what fixes it.
| KPI | How bad data hurts it | Fix |
|---|---|---|
| Bounce rate | Invalid and outdated addresses bounce directly | Verify every list before every campaign |
| Spam complaint rate | Wrong-fit or unexpected recipients mark you as spam | Target by role and fit; make opting out easy |
| Reply rate | Bounces and spam-foldering shrink the real audience | Remove invalid contacts; segment risky ones |
| Positive reply rate | Right company, wrong person means polite no's or silence | Search by job title and seniority, not just company |
| Meetings booked | Contacts without buying authority rarely take meetings | Map decision-makers per account |
| Cost per meeting | You pay for sends, tools, and time spent on dead contacts | Pay for data only when it's a usable result |
| Pipeline | Meetings with poor-fit accounts don't qualify | Tighten ideal customer profile filters |
The deliverability stakes are written into mailbox provider rules. Yahoo's sender best practices tell bulk senders to monitor hard and soft bounces and to remove invalid recipients promptly. Google requires spam rates below 0.3%. Both depend on sending only to people who exist and have a reason to hear from you.
Set up a weekly KPI review
Leading indicators move in days; lagging indicators move in quarters. Review them on different clocks.
- Every send: bounce rate and spam complaints. Stop and fix if either crosses your threshold.
- Weekly: reply rate, positive reply rate, and meetings booked, by segment and by sequence.
- Monthly: show rate, cost per meeting, and meeting-to-opportunity conversion.
- Quarterly: pipeline generated and pipeline per 1,000 contacts, by segment and source.
Write your stop rules down before the quarter starts. For example: pause any sequence whose bounce rate passes 2%, review any segment whose positive reply rate falls by half from its baseline, and retire any list source that produces meetings but no qualified opportunities after a full month. Clear thresholds turn a KPI review from a debate into a decision.
Break every KPI out by list source and segment. A blended reply rate can hide one excellent segment and one that's dragging the team down. Export results as CSV into your reporting tool or CRM, or pull them into a spreadsheet for review. If you're building lists from scratch, start with our guide to building a B2B prospect list.
How to improve each KPI
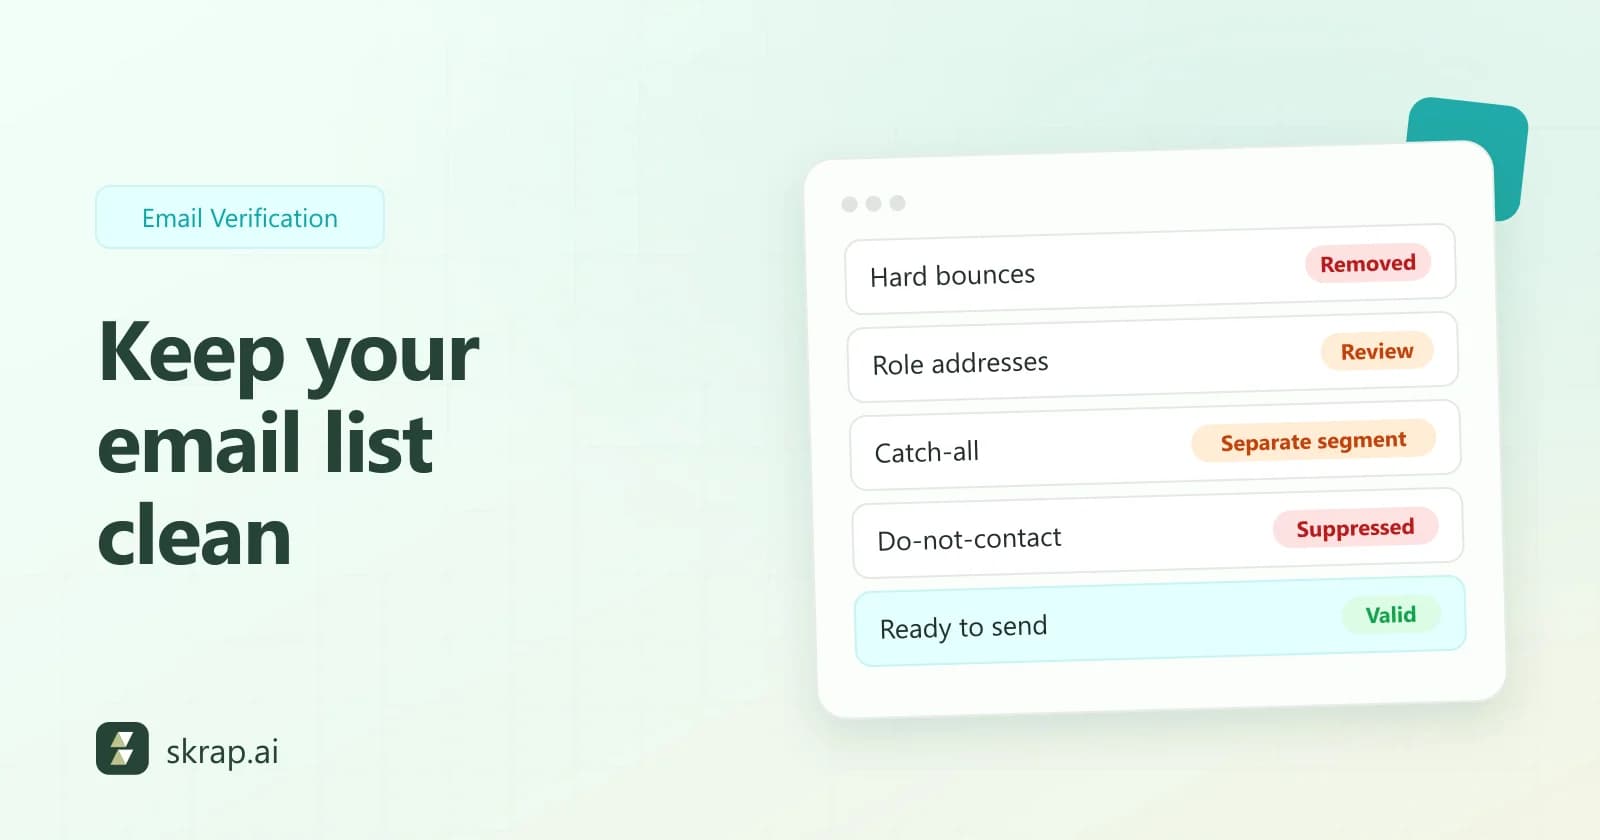
- Bounce rate: verify before every campaign and re-verify older lists. Handle catch-all results separately; see catch-all emails explained.
- Reply rate: narrow your segments and write shorter, more specific emails. Our cold email templates are a solid starting point.
- Positive reply rate: reach the person who owns the problem. Find them by title, then find their verified business email.
- Meetings booked: make the ask small and specific, and reply to positive responses within hours, not days.
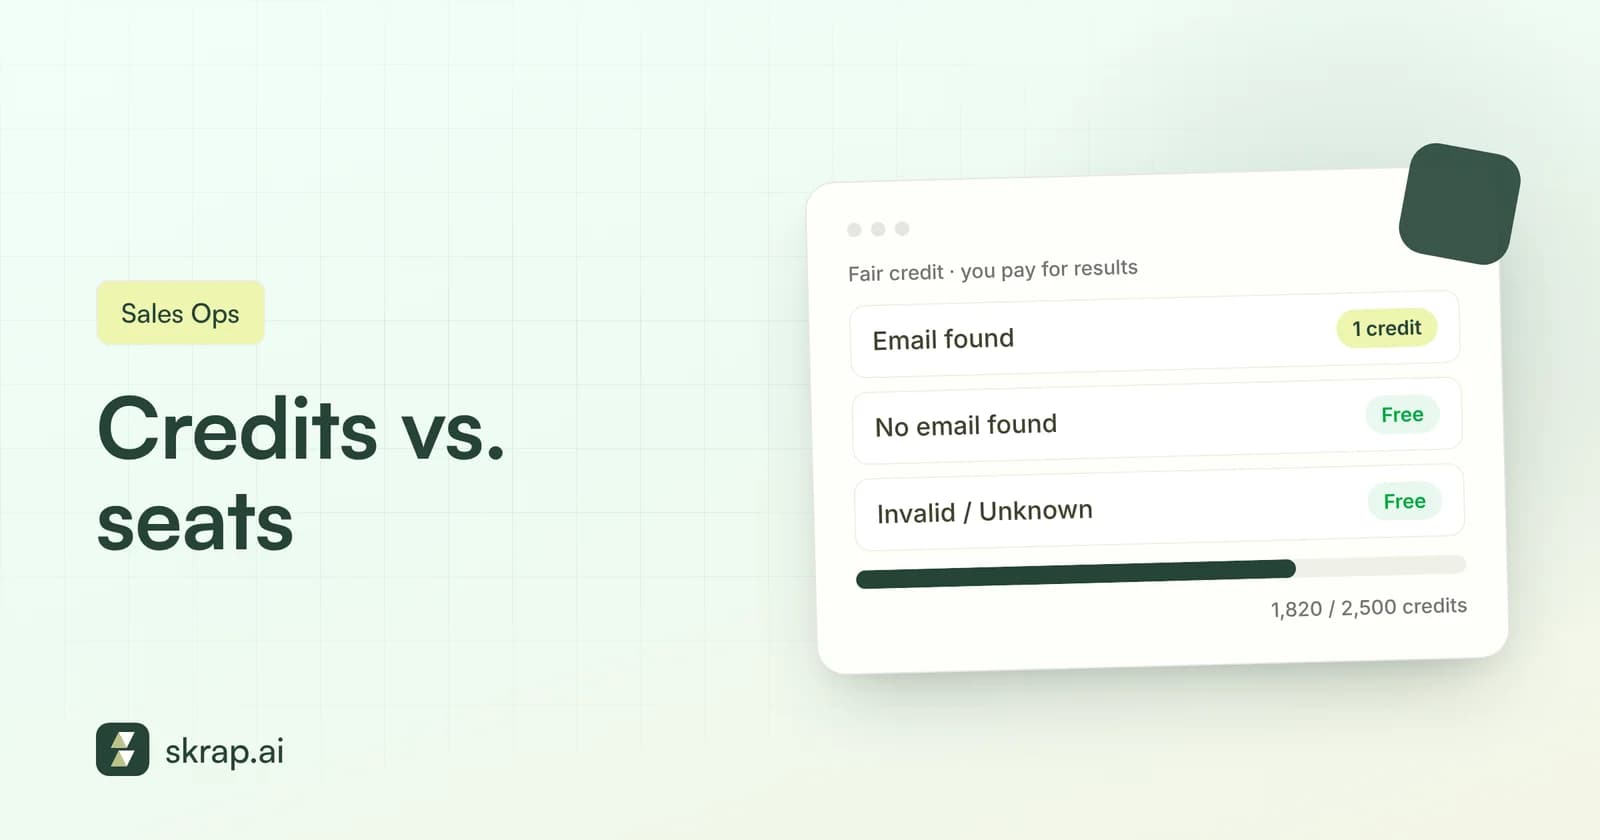
- Cost per meeting: stop paying for data that doesn't work. Under a fair-credit model, you're charged for found emails and usable verification results, not misses.
- Pipeline: feed winning segments more volume and retire the ones that produce meetings but not opportunities.
As volume grows, look at how your data costs scale too. Our comparison of credit vs. seat pricing explains why paying per successful result tends to keep cost per meeting predictable.






 No credit card required
 100 one-time free credits